In-memory arrays instead of files
Any mapping of NumPy or Awkward arrays is a valid source, so rootfig works just as well on arrays you already have in memory.
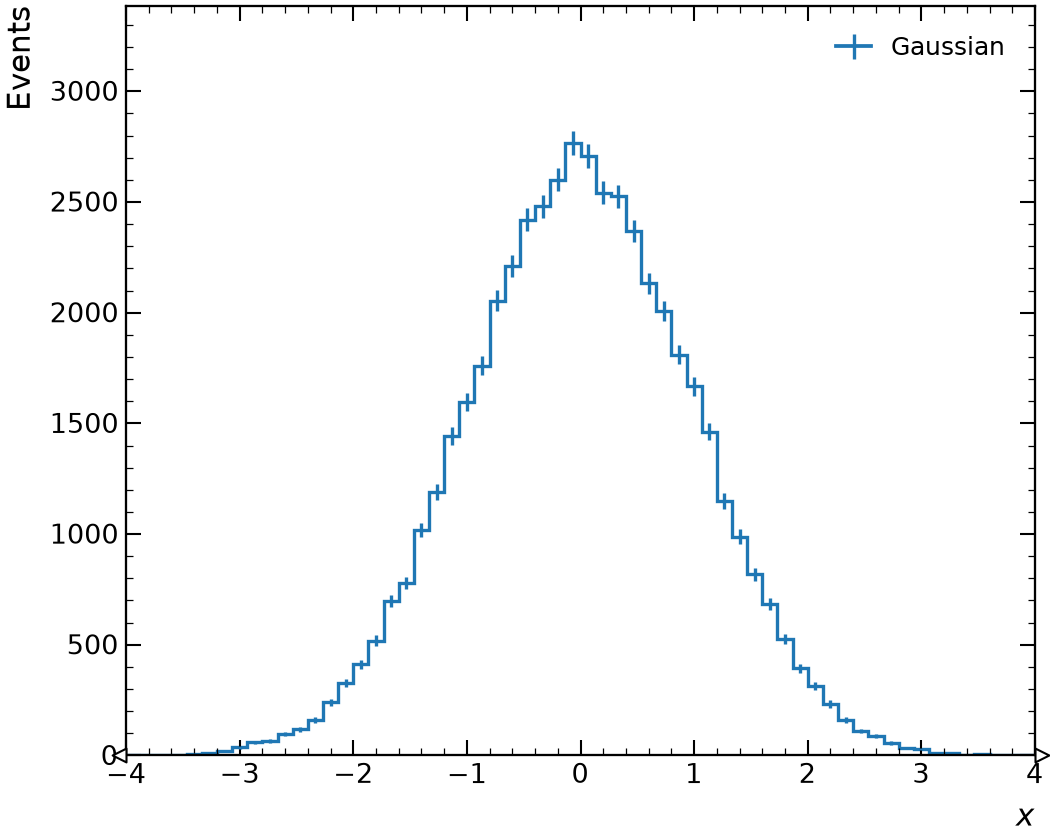
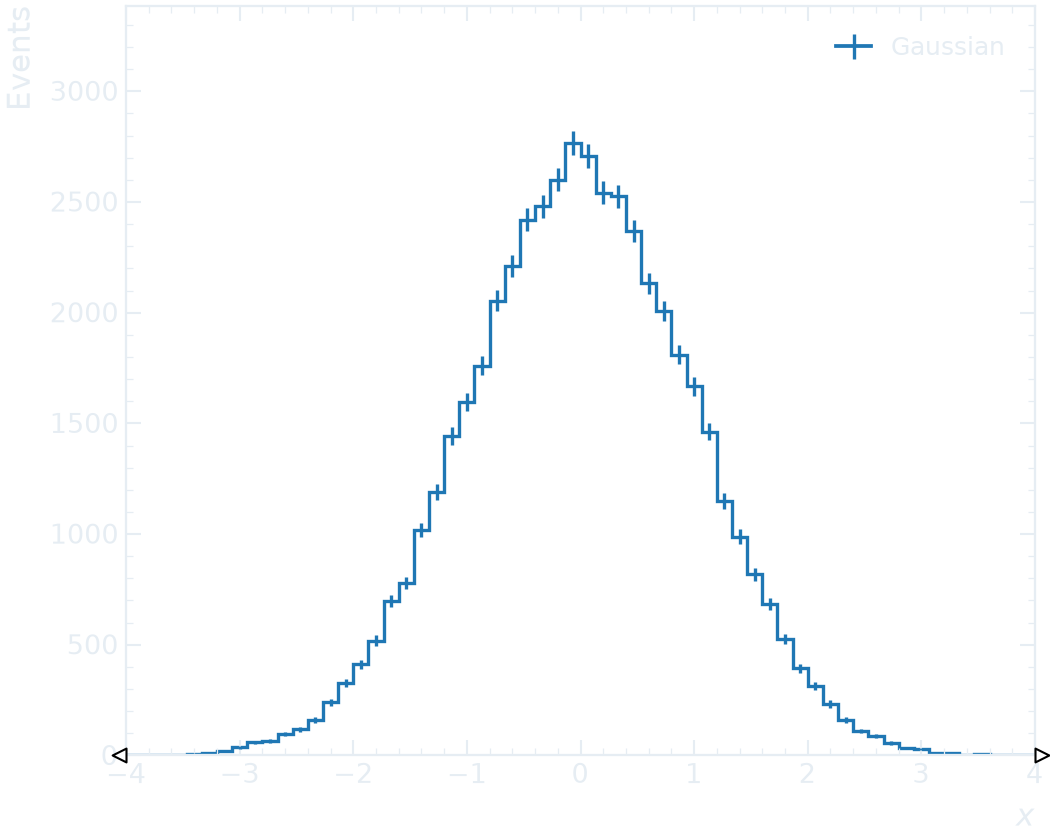
import numpy as np
import rootfig as rf

style = rf.Style()

rng = np.random.default_rng(7)
events = {"x": rng.normal(0.0, 1.0, 50_000), "w": rng.uniform(0.5, 1.5, 50_000)}
rf.plot(
    events,
    "x",
    weight="w",
    bins=(60, -4, 4),
    label="Gaussian",
    xlabel="$x$",
    errorbars=True,
    style=style,
)
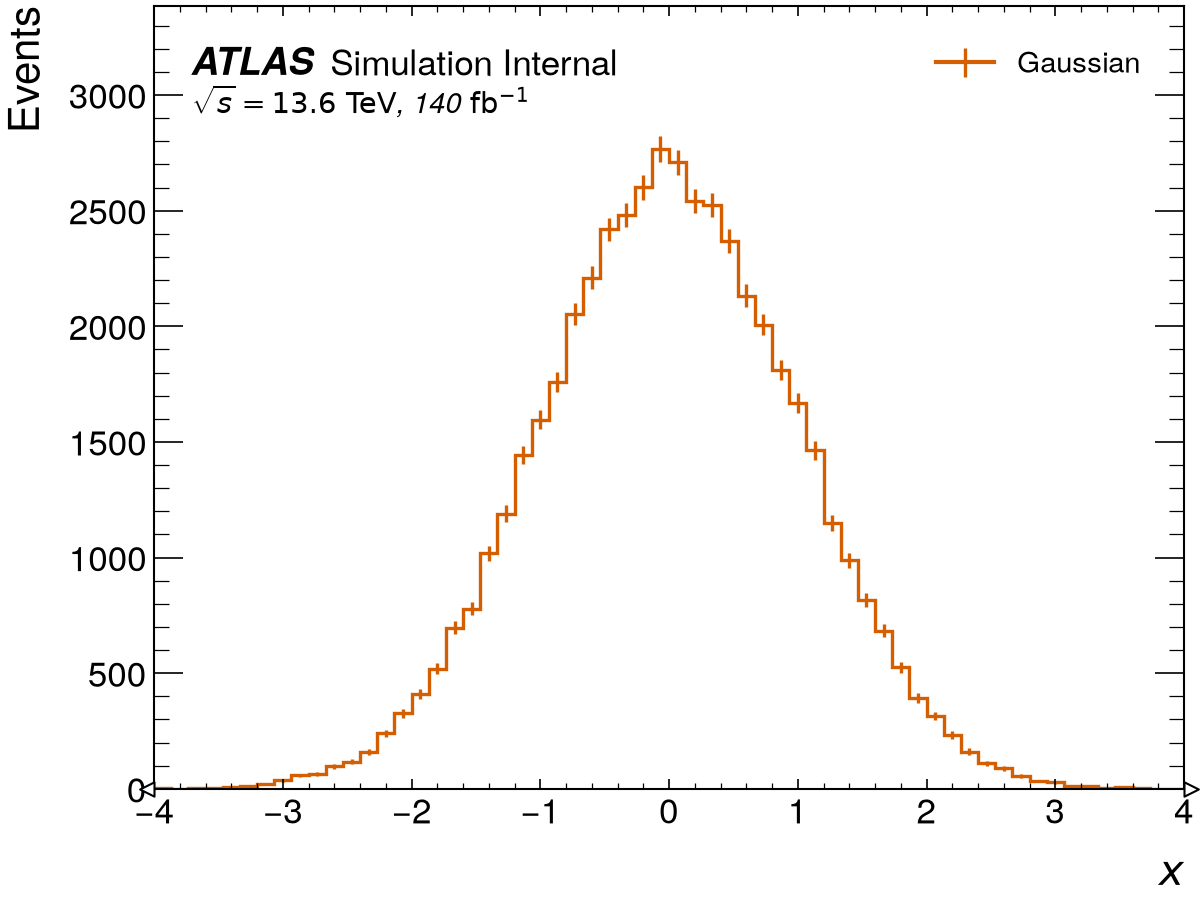
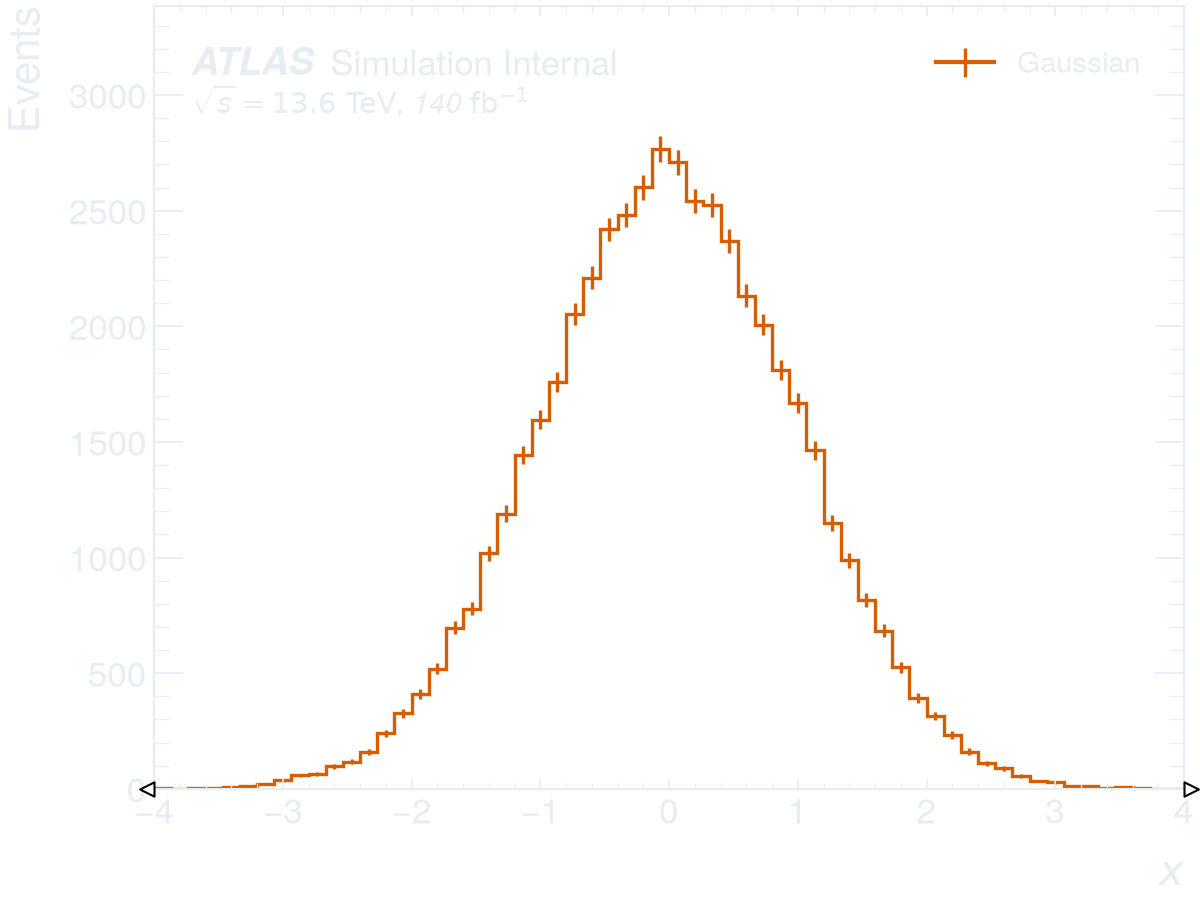
import numpy as np
import rootfig as rf

style = rf.Style(experiment="ATLAS", status="Internal", lumi=140, com=13.6)

rng = np.random.default_rng(7)
events = {"x": rng.normal(0.0, 1.0, 50_000), "w": rng.uniform(0.5, 1.5, 50_000)}
rf.plot(
    events,
    "x",
    weight="w",
    bins=(60, -4, 4),
    label="Gaussian",
    xlabel="$x$",
    errorbars=True,
    style=style,
)
import numpy as np
import rootfig as rf

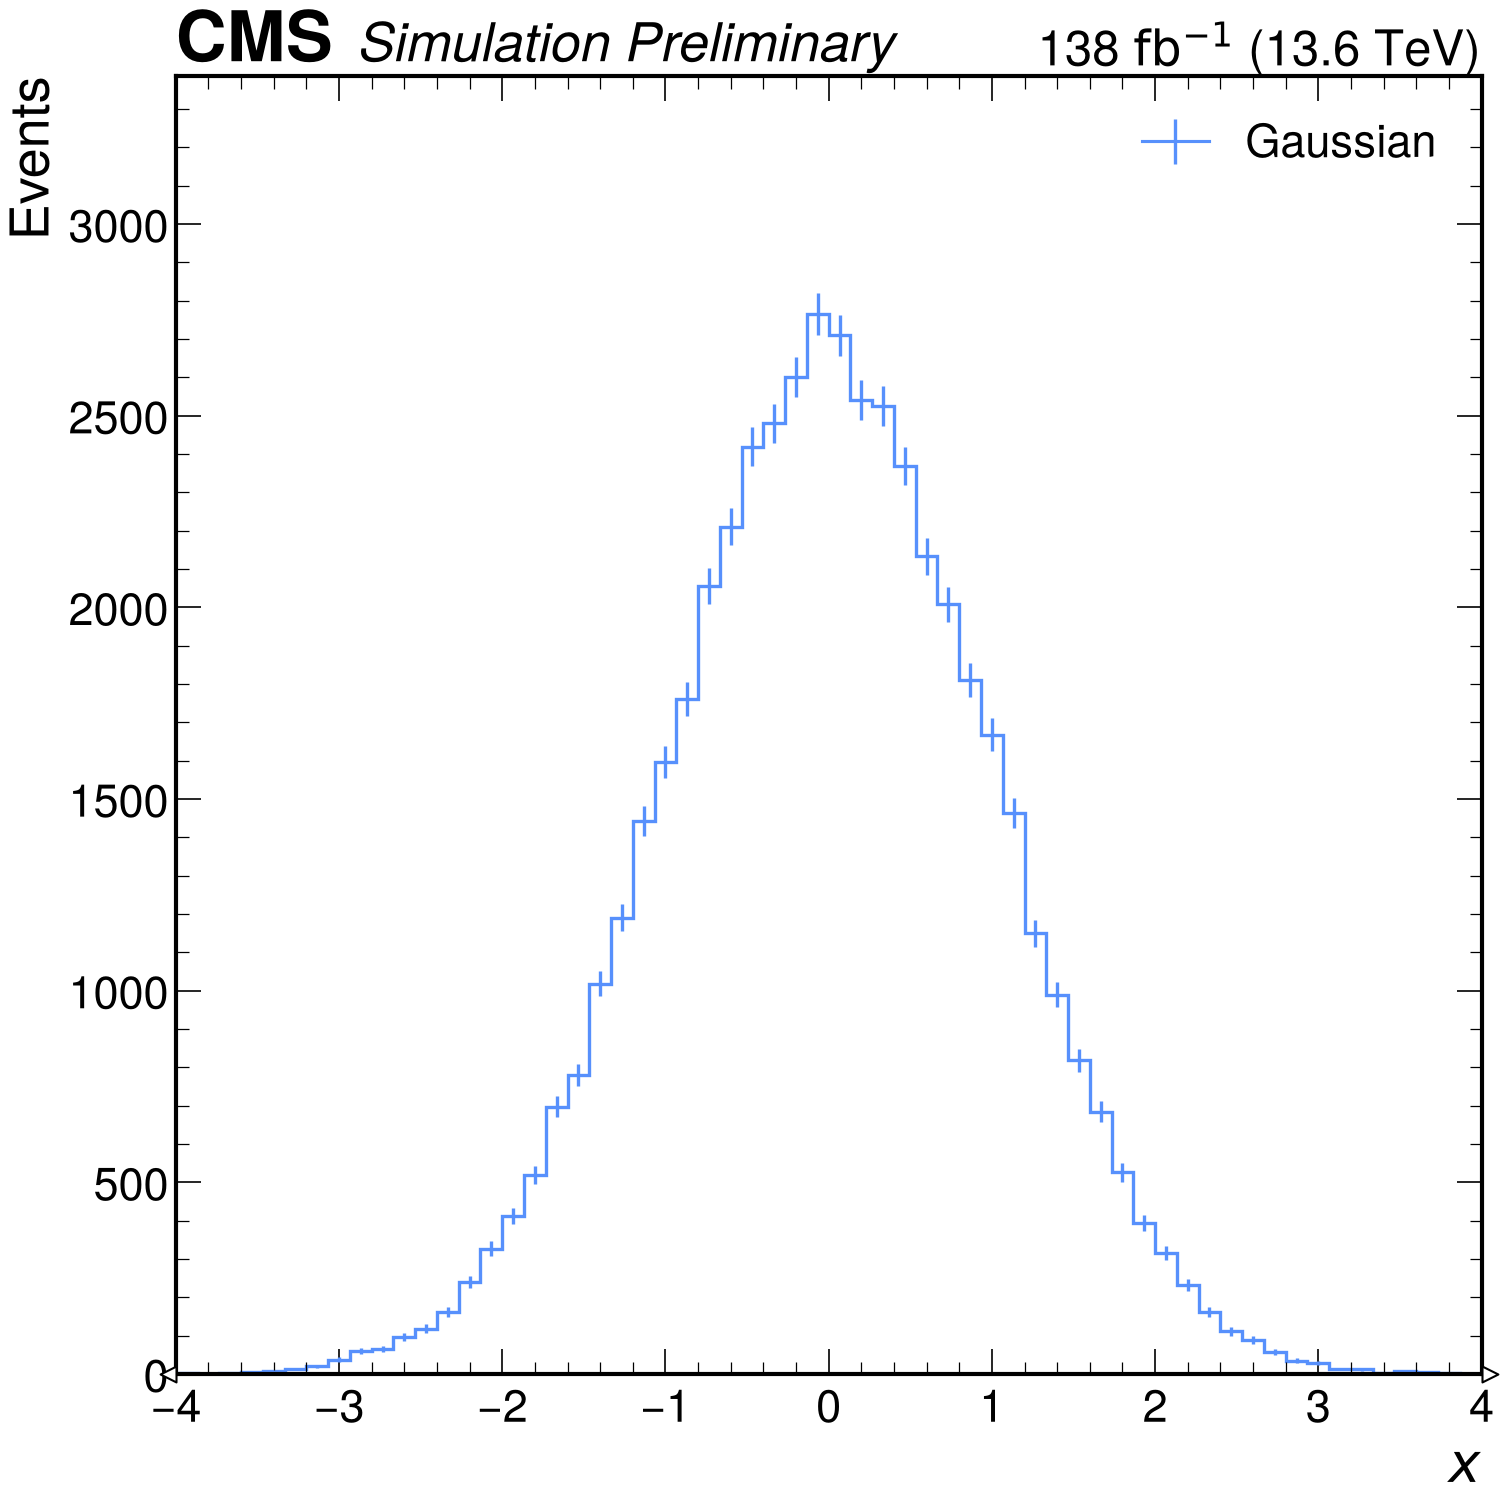
style = rf.Style(experiment="CMS", status="Preliminary", lumi=138, com=13.6)

rng = np.random.default_rng(7)
events = {"x": rng.normal(0.0, 1.0, 50_000), "w": rng.uniform(0.5, 1.5, 50_000)}
rf.plot(
    events,
    "x",
    weight="w",
    bins=(60, -4, 4),
    label="Gaussian",
    xlabel="$x$",
    errorbars=True,
    style=style,
)
import numpy as np
import rootfig as rf

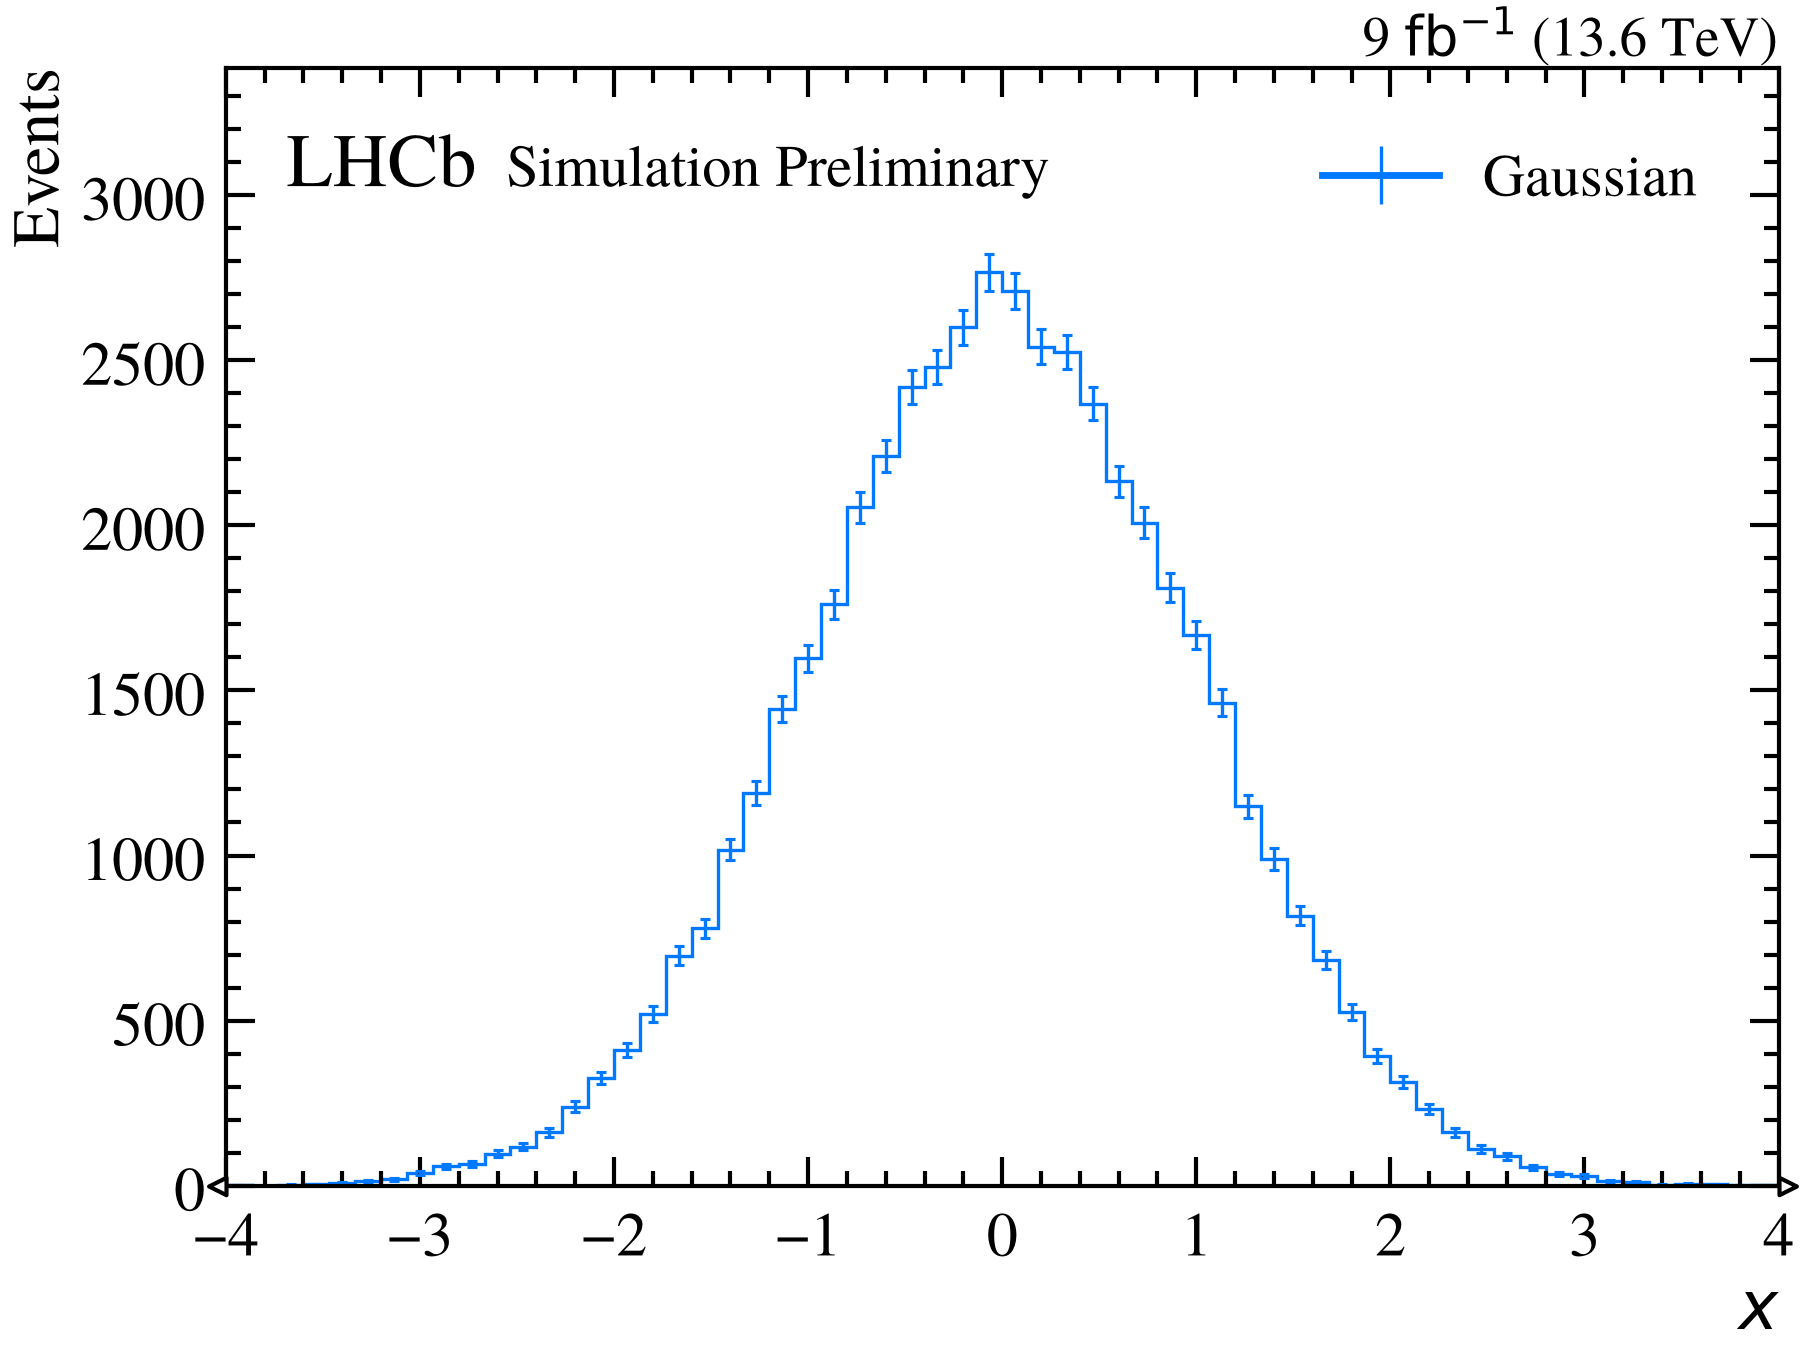
style = rf.Style(experiment="LHCb", status="Preliminary", lumi=9, com=13.6)

rng = np.random.default_rng(7)
events = {"x": rng.normal(0.0, 1.0, 50_000), "w": rng.uniform(0.5, 1.5, 50_000)}
rf.plot(
    events,
    "x",
    weight="w",
    bins=(60, -4, 4),
    label="Gaussian",
    xlabel="$x$",
    errorbars=True,
    style=style,
)
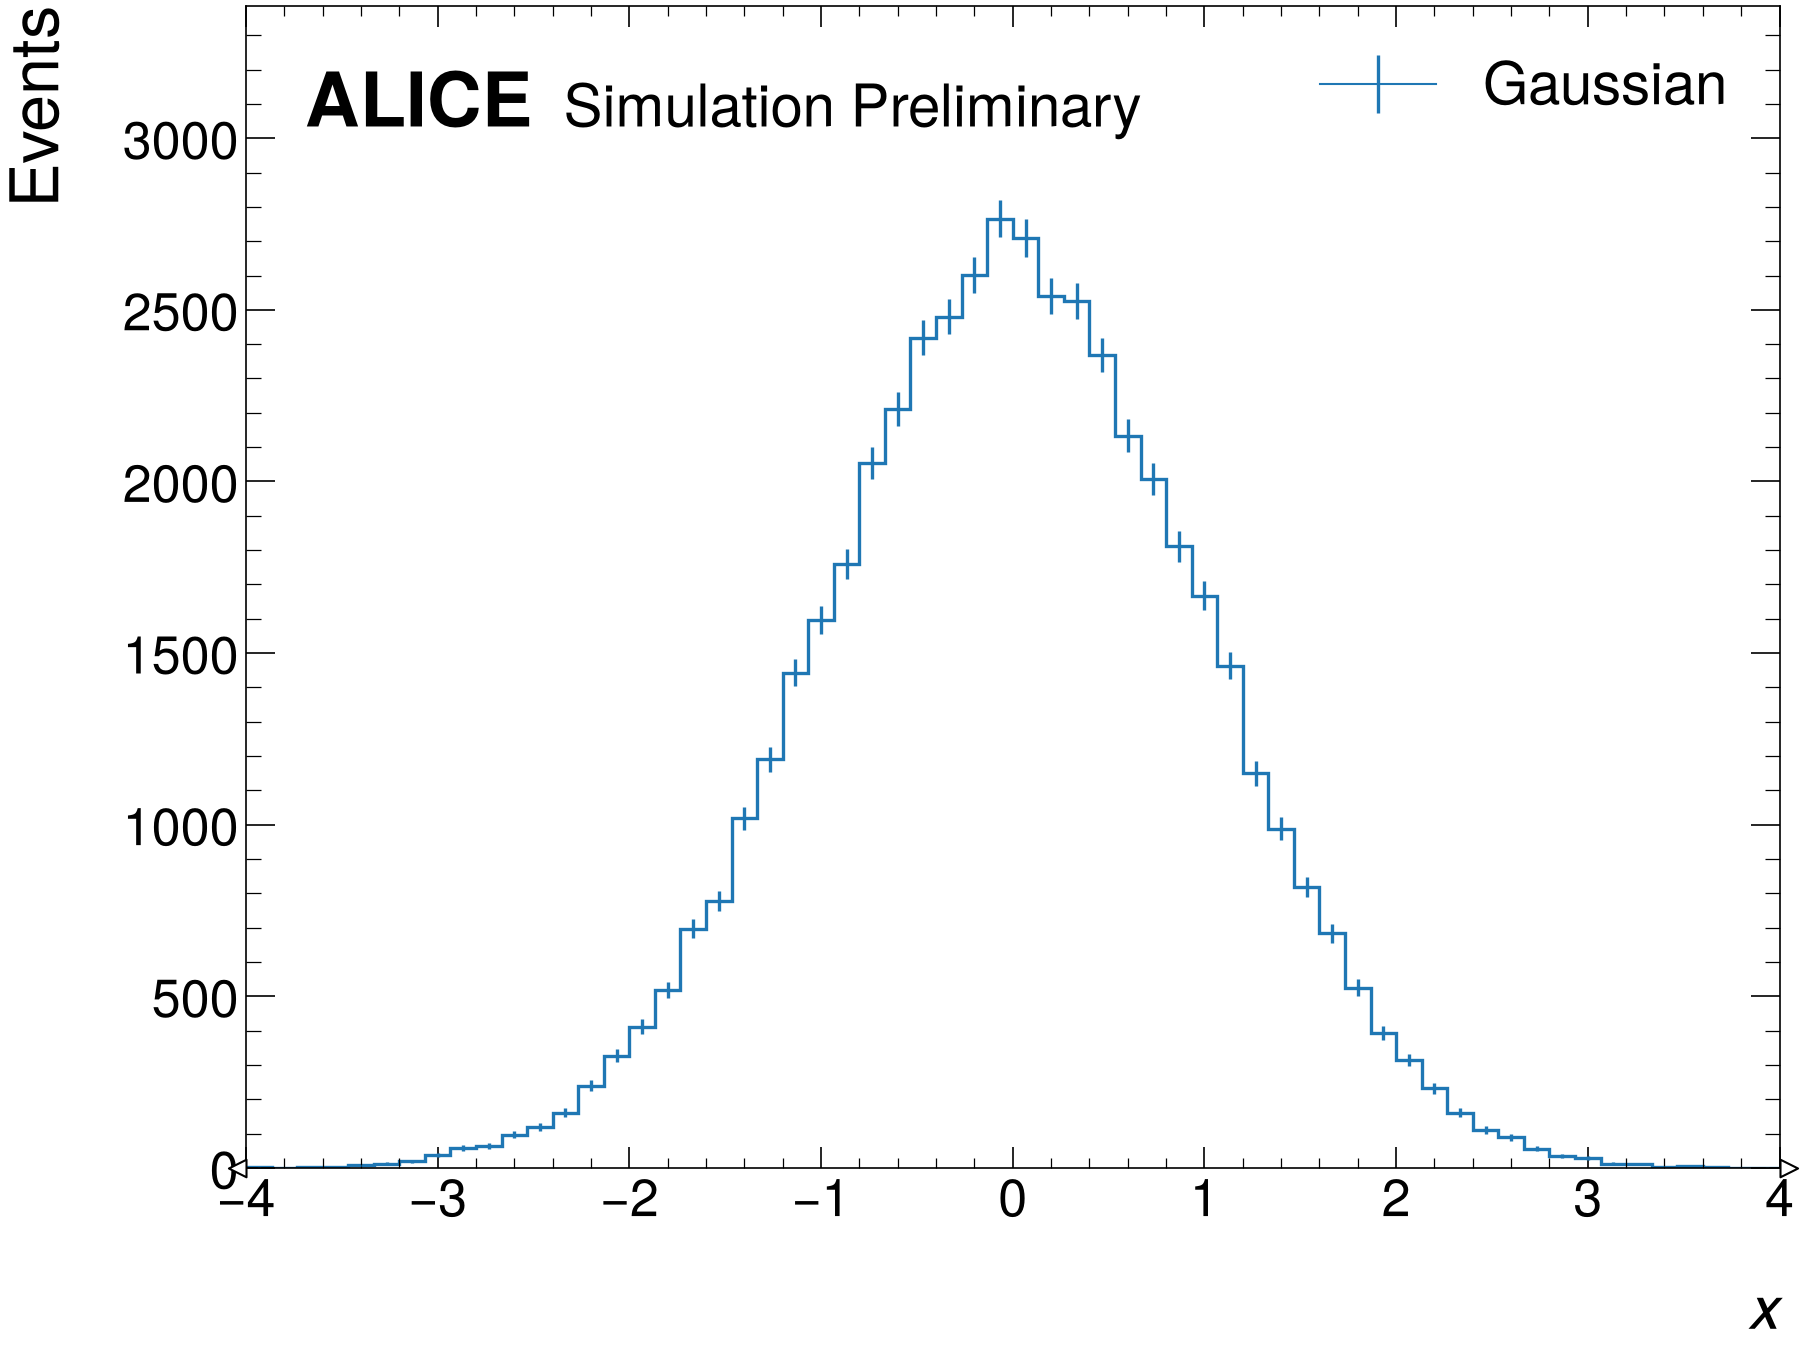
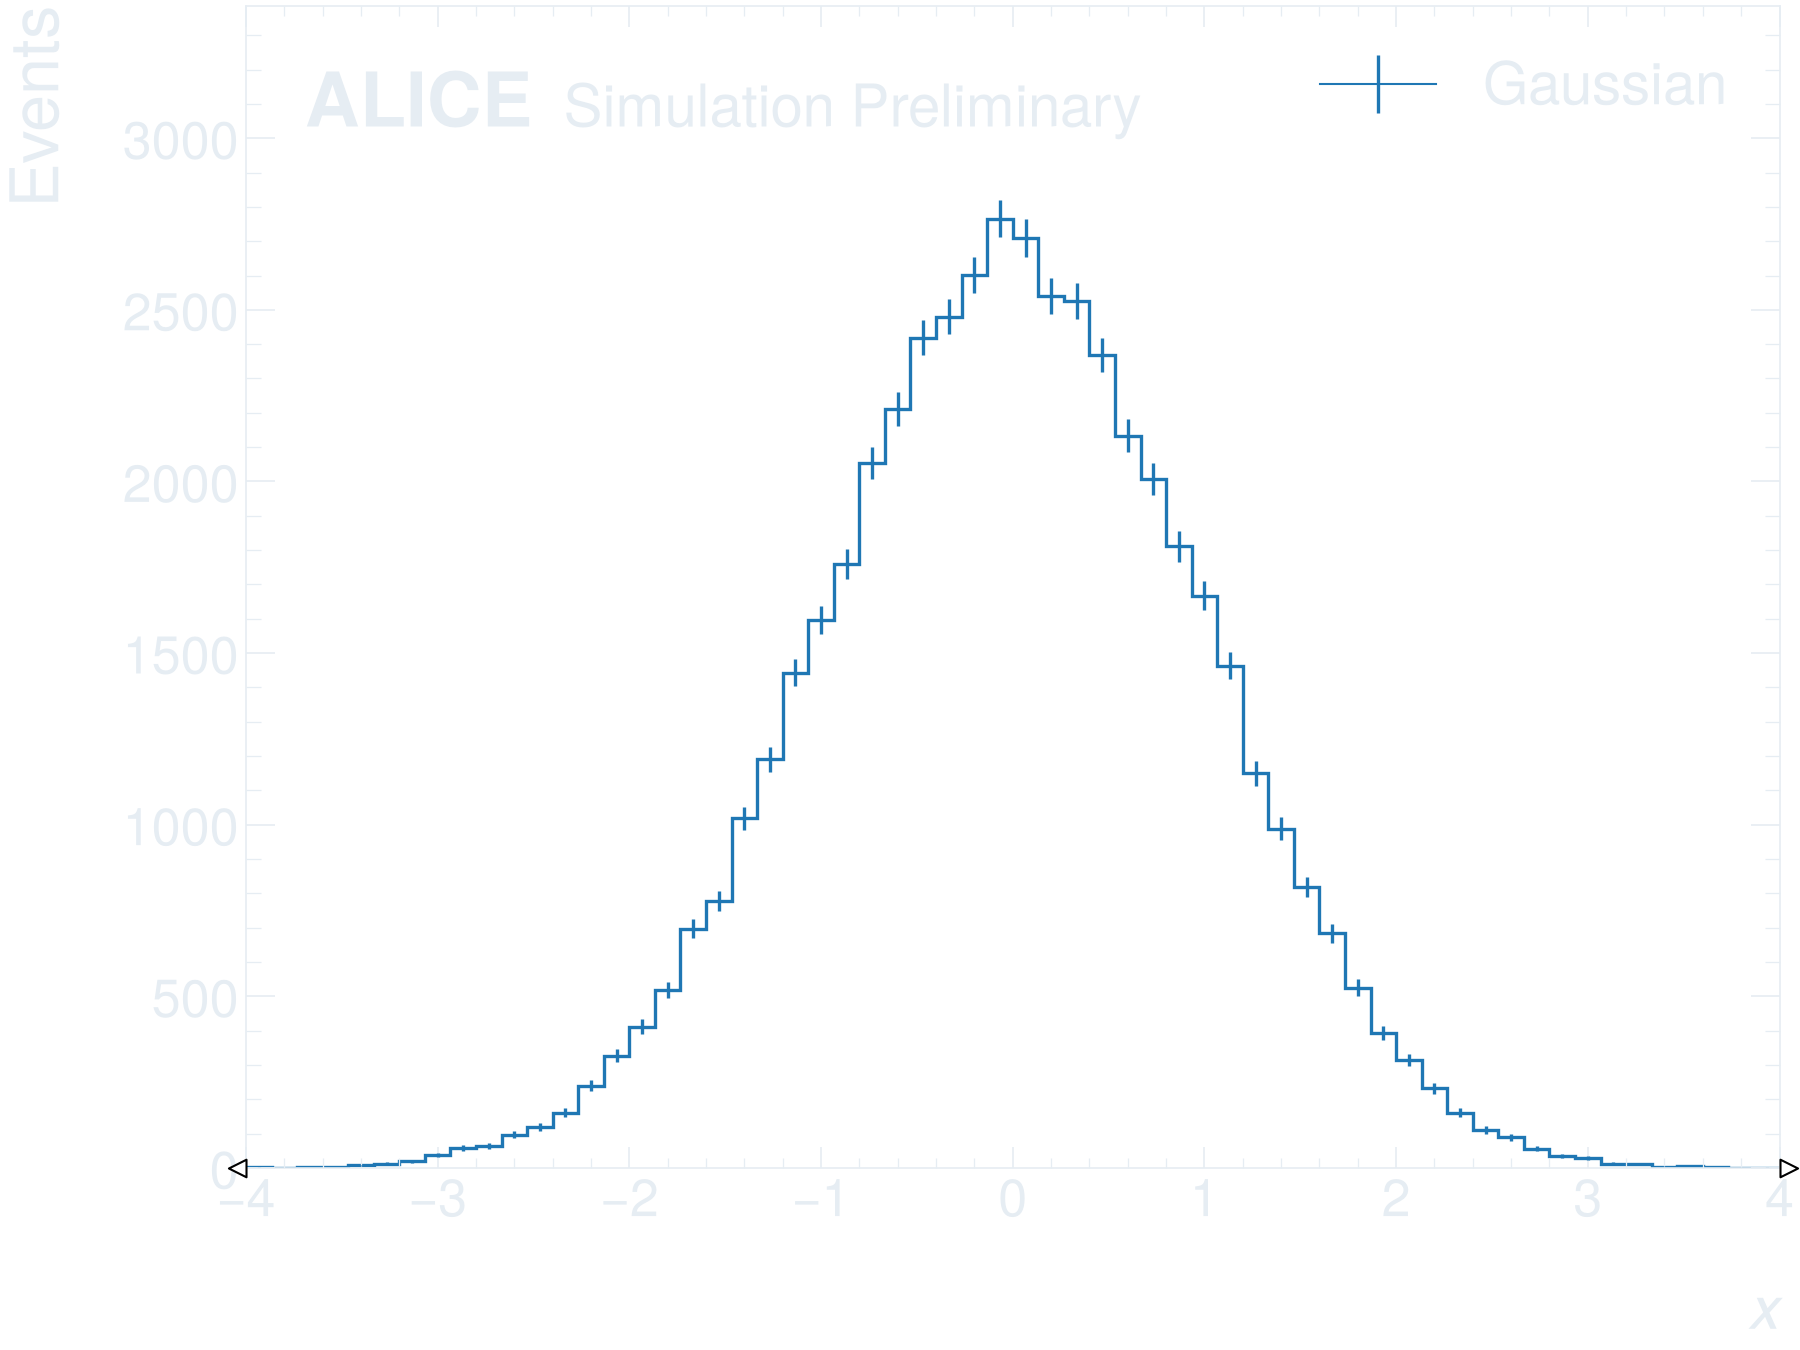
import numpy as np
import rootfig as rf

style = rf.Style(experiment="ALICE", status="Preliminary")

rng = np.random.default_rng(7)
events = {"x": rng.normal(0.0, 1.0, 50_000), "w": rng.uniform(0.5, 1.5, 50_000)}
rf.plot(
    events,
    "x",
    weight="w",
    bins=(60, -4, 4),
    label="Gaussian",
    xlabel="$x$",
    errorbars=True,
    style=style,
)
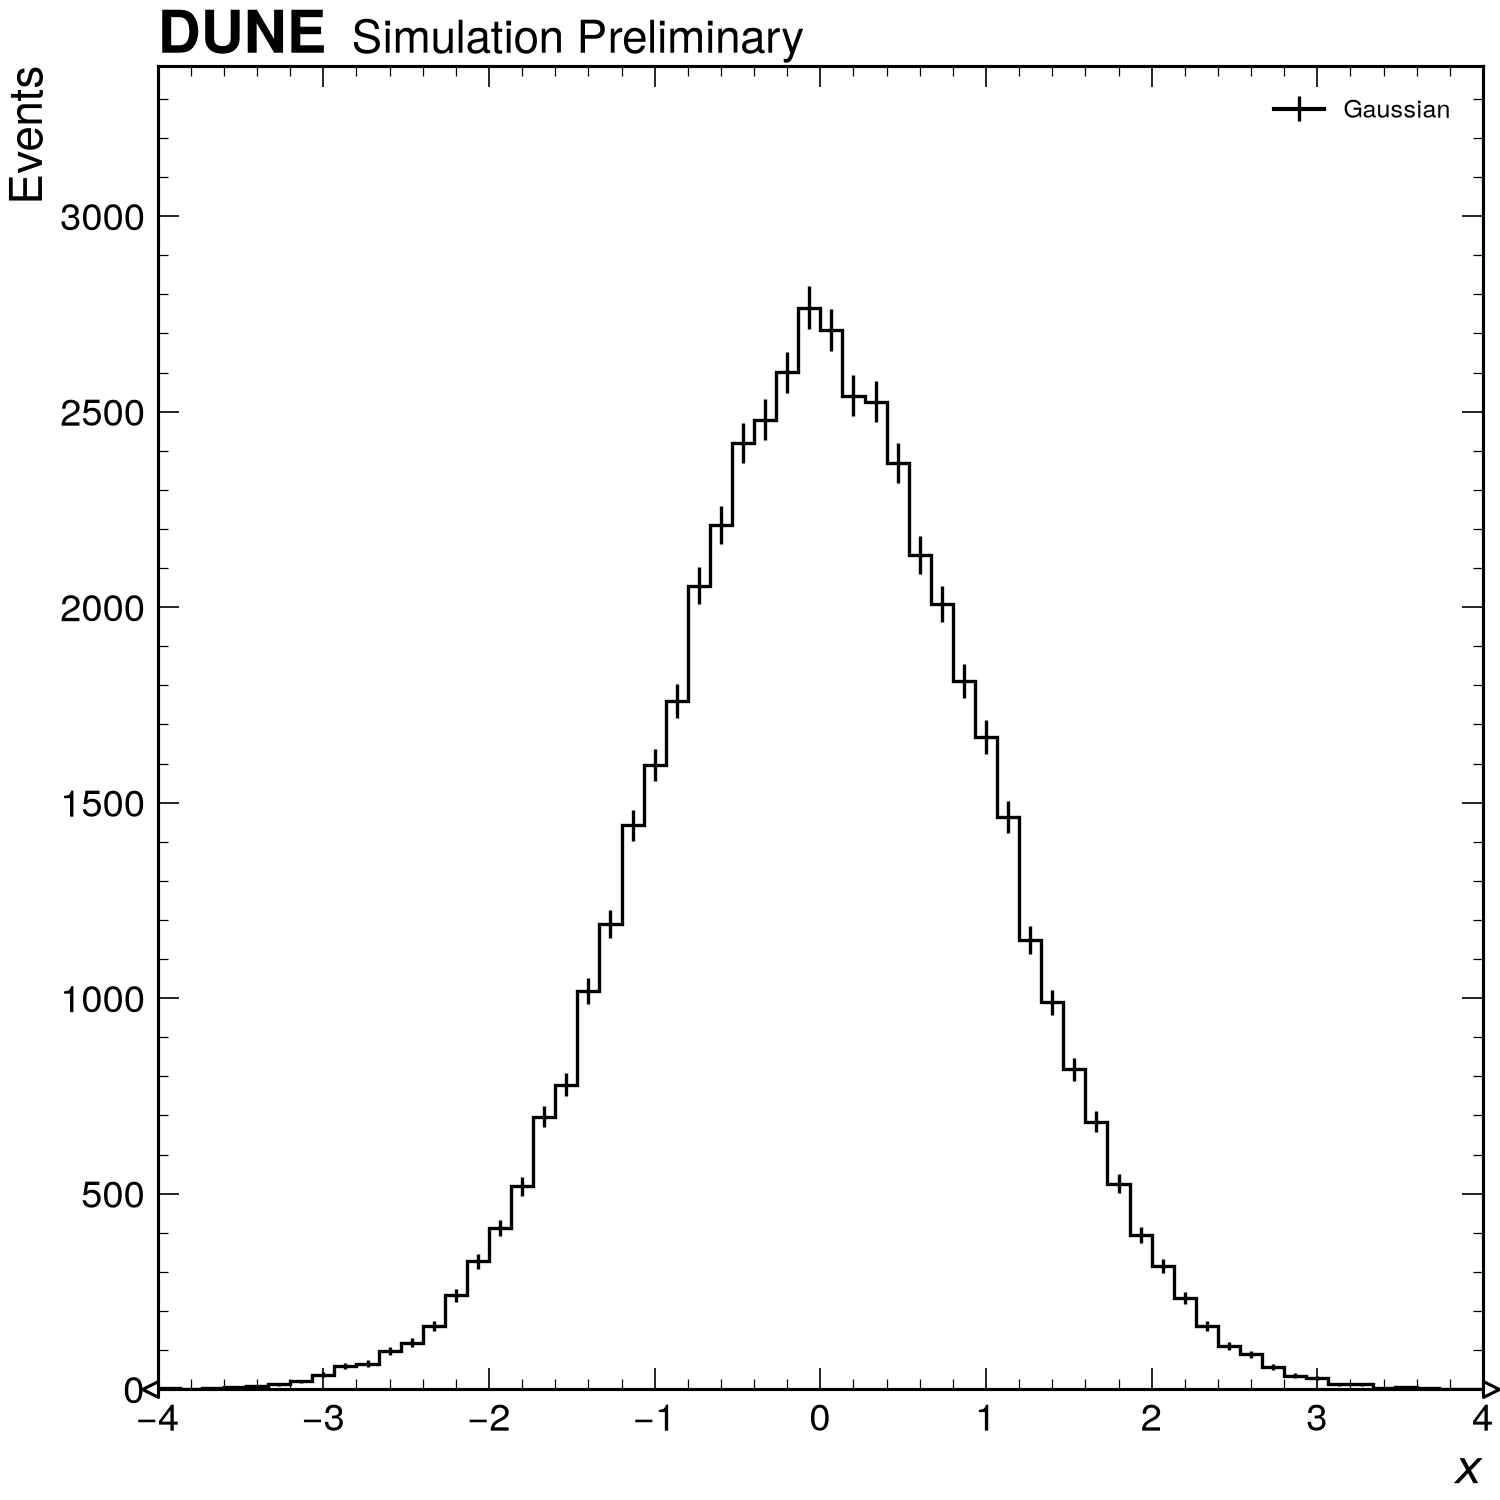
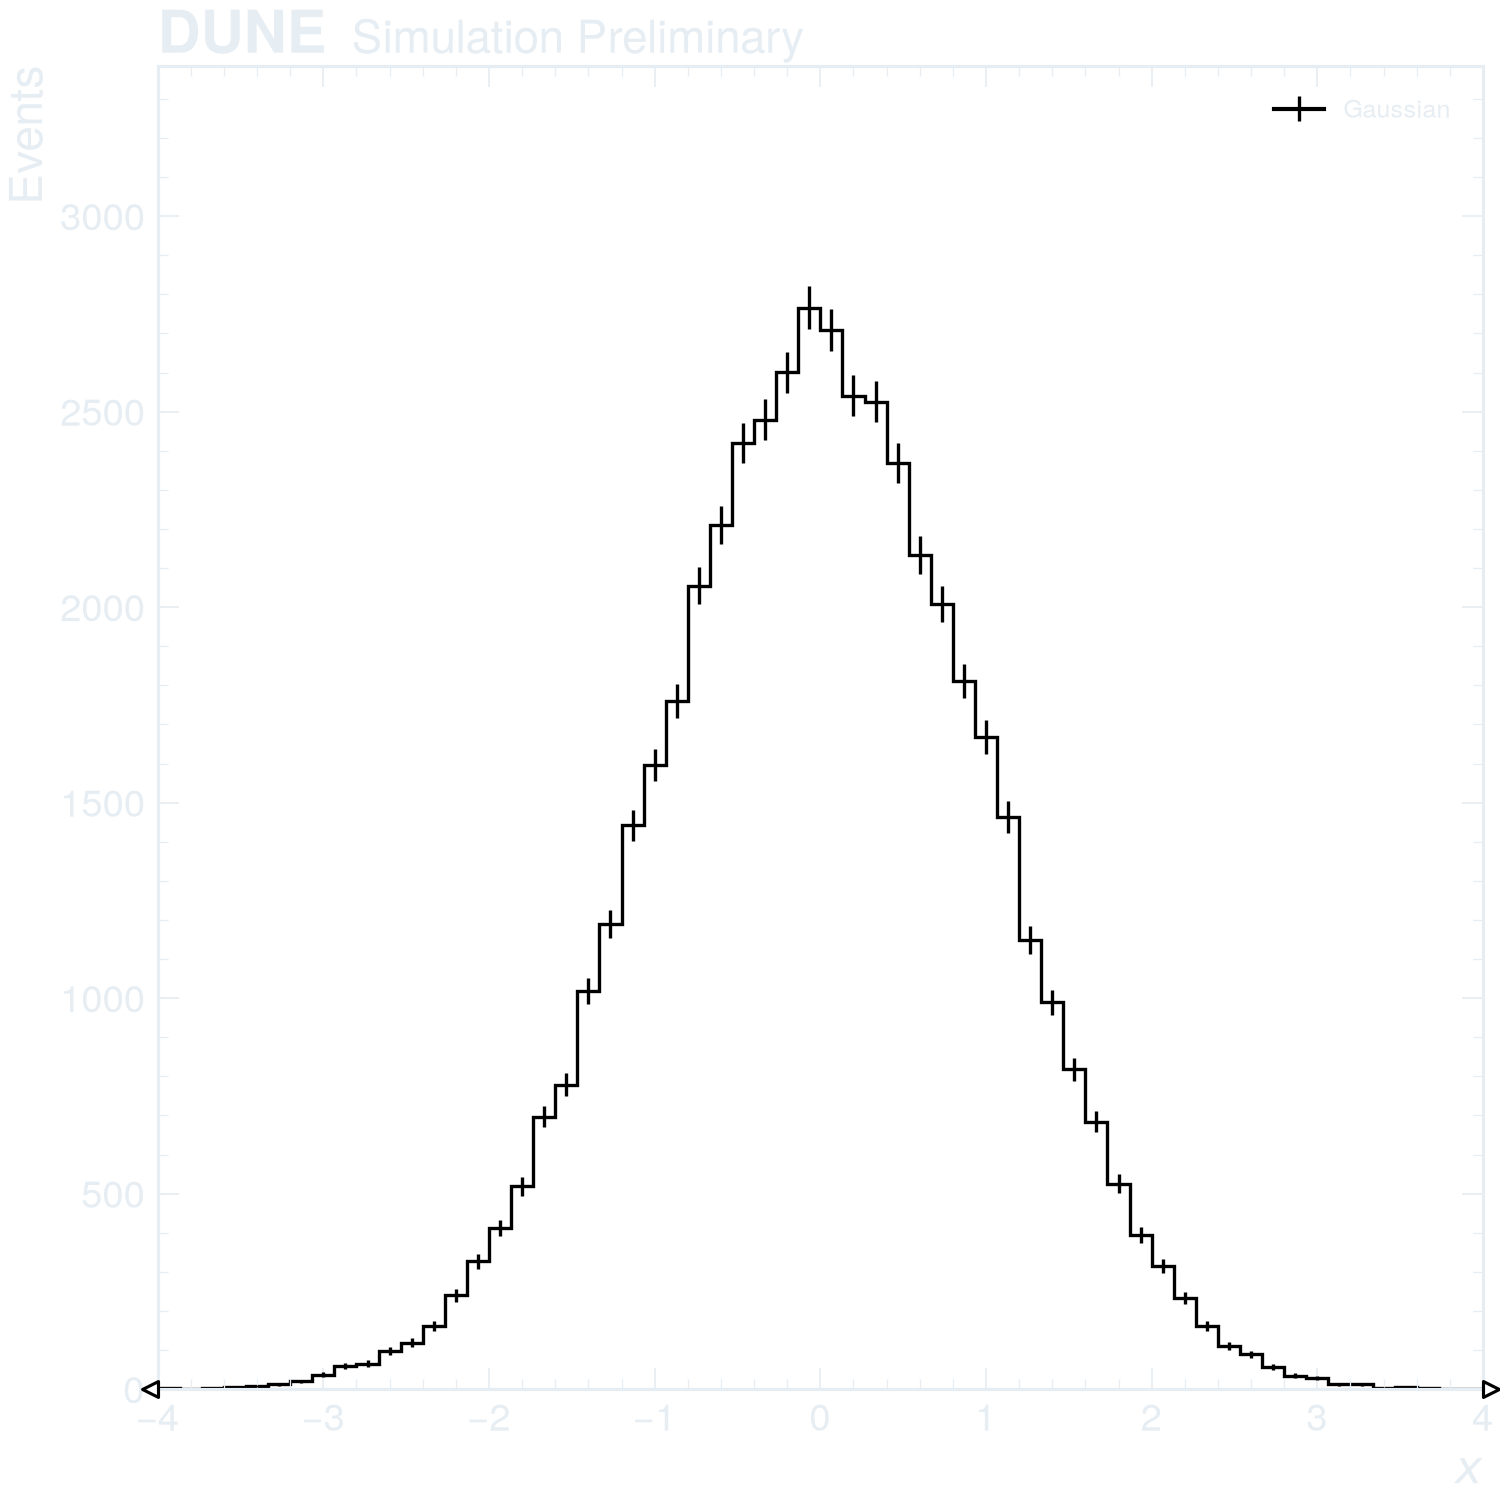
import numpy as np
import rootfig as rf

style = rf.Style(experiment="DUNE", status="Preliminary")

rng = np.random.default_rng(7)
events = {"x": rng.normal(0.0, 1.0, 50_000), "w": rng.uniform(0.5, 1.5, 50_000)}
rf.plot(
    events,
    "x",
    weight="w",
    bins=(60, -4, 4),
    label="Gaussian",
    xlabel="$x$",
    errorbars=True,
    style=style,
)