Many plots in a loop, saved by variable name
The typical analysis script: a list of variables, one call each, saved to a directory.
Given a directory (created if needed), Plot.save names the file after the variable;
formats writes several at once.
import rootfig as rf

selection = rf.Cut("count(Muon_isTight) >= 1") & "nJet >= 1"
variables = [
    rf.Variable("MET", bins=(40, 0, 400), label=r"$E_T^{miss}$", unit="GeV"),
    rf.Variable("nMuon", bins=(7, -0.5, 6.5), label=r"$N_{\mu}$"),
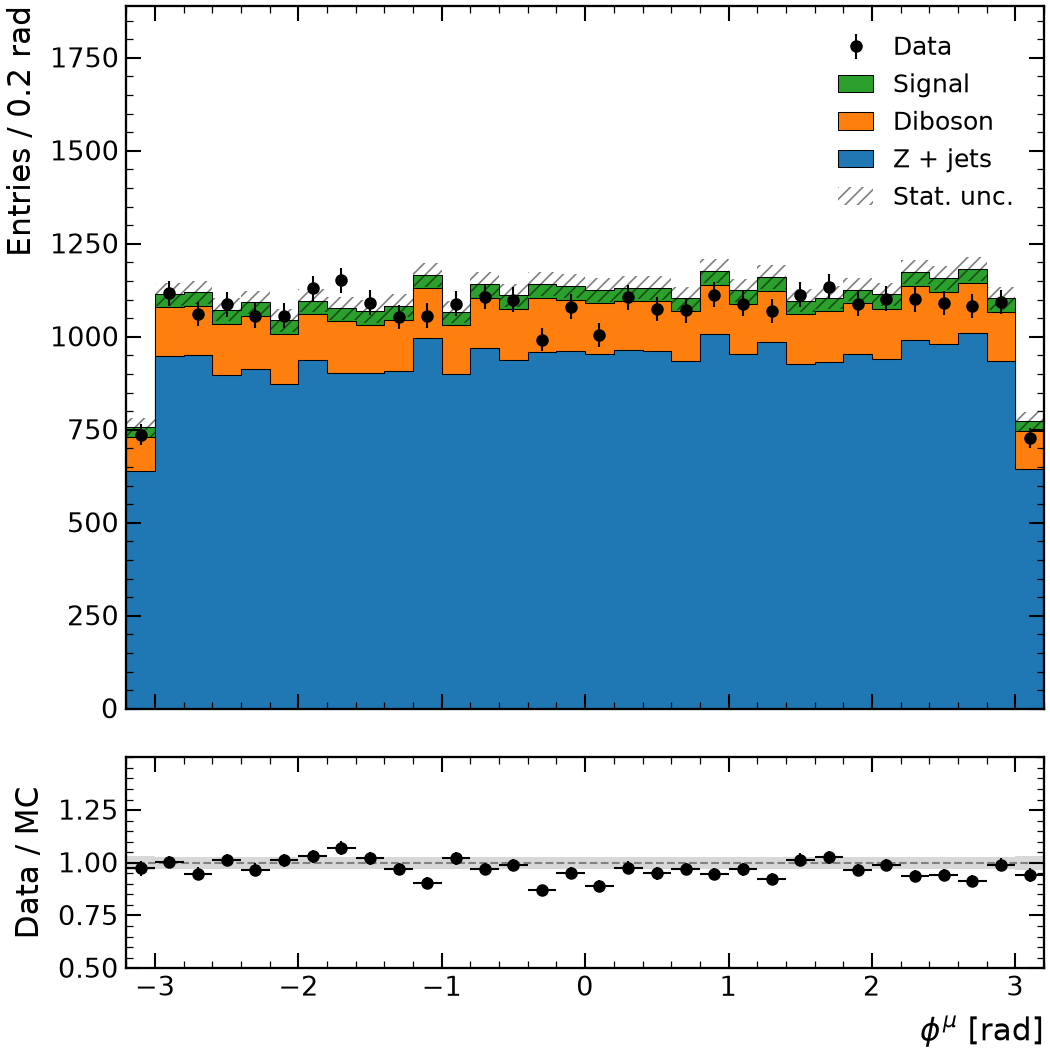
    rf.Variable("Muon_phi", bins=(32, -3.2, 3.2), label=r"$\phi^{\mu}$", unit="rad"),
]
for variable in variables:
    p = rf.plot(mc, variable, observed=data, selection=selection, stack=True, ratio=True)
    p.save("plots/", formats=["pdf", "png"])  # plots/MET.pdf, plots/MET.png, ...
Setup
The code reads the toy dataset. In a checkout of rootfig, python examples/gallery writes it to examples/out/ in a few seconds; run the code inside that directory.
It uses these samples and variables, shared by the gallery examples (see Samples, variables, cuts and styles):
signal = rf.Sample("signal.root", tree="events", label="Signal", weight="weight", scale=0.03)
zjets = rf.Sample("background.root", tree="events", label="Z + jets", weight="weight")
diboson = rf.Sample("diboson.root", tree="events", label="Diboson", weight="weight", scale=0.15)
data = rf.Sample("data.root", tree="events", label="Data", is_data=True)
mc = [zjets, diboson, signal]  # stacked bottom to top

pt = rf.Variable("Muon_pt", bins=(30, 0, 300), label=r"$p_T^{\mu}$", unit="GeV")
mll = rf.Variable("m_ll", bins=(70, 50, 260), label=r"$m_{\ell\ell}$", unit="GeV")
met = rf.Variable("MET", bins=(40, 0, 400), label=r"$E_T^{miss}$", unit="GeV")