Low counts: Poisson intervals for data
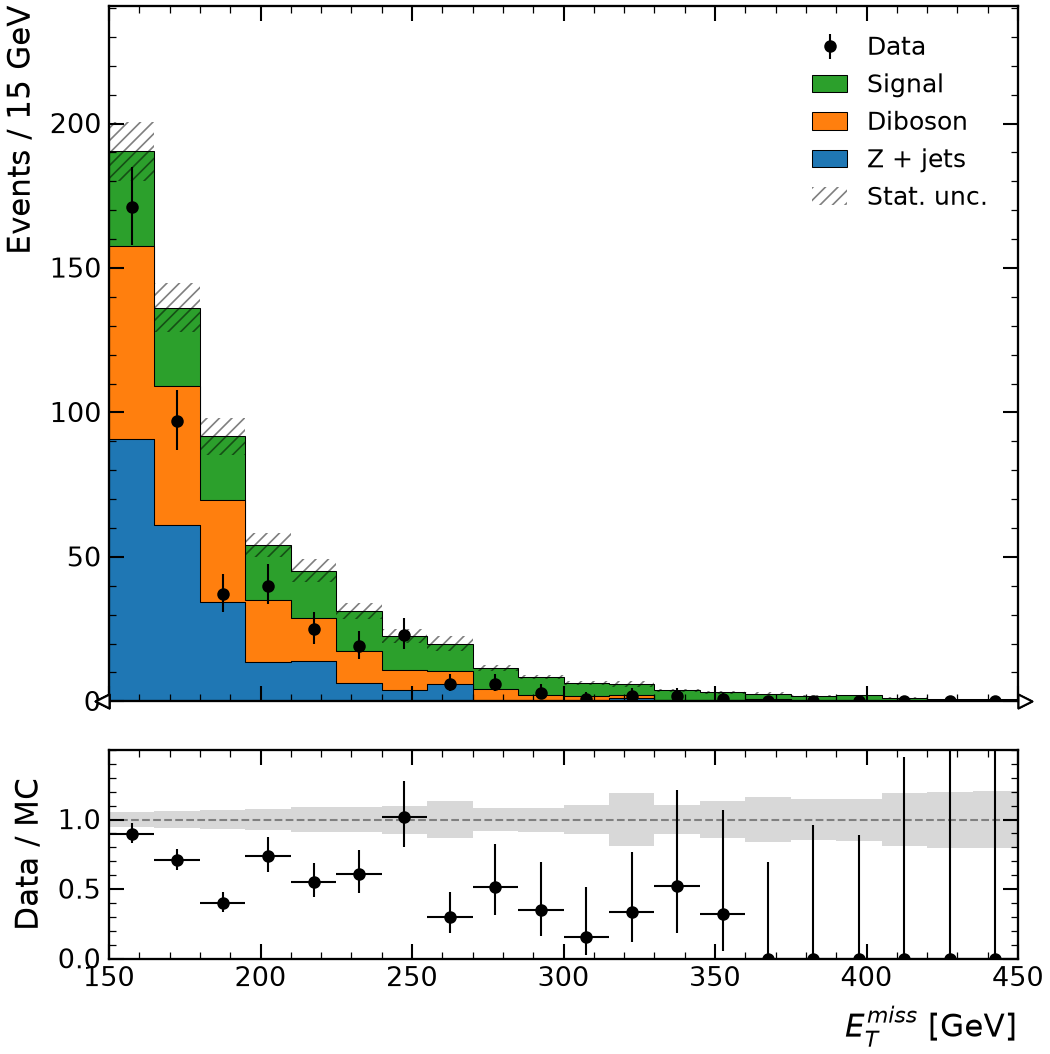
data_errors="poisson" draws data with the Garwood (Poisson) 68 % interval of its
counts, ROOT's TH1::kPoisson: asymmetric where few events fall into a bin, and with
an upper error for an empty one, in the ratio panel as in the main one. By default data
gets sqrt(N), as a TH1 does; data_errors="auto" takes Poisson intervals
wherever data holds unit-weight counts.
import rootfig as rf

met = rf.Variable("MET", bins=(20, 150, 450), label=r"$E_T^{miss}$", unit="GeV")
rf.plot(mc, met, observed=data, stack=True, panel="ratio", data_errors="poisson")
Setup
The code reads the toy dataset. In a checkout of rootfig, python examples/gallery writes it to examples/out/ in a few seconds; run the code inside that directory.
It uses these samples and variables, shared by the gallery examples (see Samples, variables, cuts and styles):
signal = rf.Sample("signal.root", tree="events", label="Signal", weight="weight", scale=0.03)
zjets = rf.Sample("background.root", tree="events", label="Z + jets", weight="weight")
diboson = rf.Sample("diboson.root", tree="events", label="Diboson", weight="weight", scale=0.15)
data = rf.Sample("data.root", tree="events", label="Data", is_data=True)
mc = [zjets, diboson, signal]  # stacked bottom to top

pt = rf.Variable("Muon_pt", bins=(30, 0, 300), label=r"$p_T^{\mu}$", unit="GeV")
mll = rf.Variable("m_ll", bins=(70, 50, 260), label=r"$m_{\ell\ell}$", unit="GeV")
met = rf.Variable("MET", bins=(40, 0, 400), label=r"$E_T^{miss}$", unit="GeV")